Previous - 3.3.2 Bias Adjustments 1941 to Present Index Next - 3.3.4 Refinements to Estimates of Pervasive Systematic Errors
3.3.3 Estimating Uncertainty in Bias Adjustments
Folland and Parker [1995] did not explicitly estimate the uncertainties in their adjustments. Rayner et al. [2006] explored the parametric uncertainty in the Folland and Parker [1995] adjustments using a Monte-Carlo method. In Smith and Reynolds [2004] the uncertainty in the bias adjustments was estimated by taking the mean-squared difference between the Smith and Reynolds [2002] adjustments and the Folland and Parker [1995] adjustments, a first-order estimate of the structural uncertainty.
Kennedy et al. [2011c] used a Monte-Carlo method to explore the parametric uncertainty within their particular approach to bias adjustment. Hirahara et al. [2013] also provide uncertainties on their adjustments that are a combination of analysis uncertainties and regression uncertainty. Liu et al. [2015] used a Monte-carlo method to explore parametric uncertainty associated with a broad range of parameter choices in Huang et al. [2015]. The approach was refined in Huang et al. [2016]. As yet, there is no uncertainty analysis accompanying Huang et al. [2017].
An important component of the uncertainty of adjustments for the effects of persistent systematic errors arises from a lack of knowledge concerning how the measurements were made. Metadata are often missing, incomplete or ambiguous and sometimes different sources give conflicting information. Kent et al. [2007] assessed metadata from ICOADS and WMO Publication 47. They found disagreement in around 20-40% of cases where metadata were available from both sources. Kennedy et al. [2011c] allowed for up to 50% uncertainty in metadata assignments based on the discrepancy between observer instructions and measurement methods recorded in WMO Publication 47. Hirahara et al. [2013] used differences between subsets of data to infer the fraction of observations made using different methods.
Figure 6 compares estimated biases and metadata assignments from Kennedy et al. [2011c] and Hirahara et al. [2013]. It shows that from 1945, the estimated biases agree within their parametric uncertainty ranges (Figure 6a) and that the fractions of measurement methods estimated by Kennedy et al. [2011c] from literature and other metadata are consistent with the fractions inferred from the data by Hirahara et al. [2013] (Figure 6b). However, there are two key differences that highlight the importance of structural uncertainty for understanding the bias adjustments. The first difference is that the phasing out of uninsulated buckets in Hirahara et al. [2013] happens earlier and faster than allowed for in the parametric uncertainty analysis of Kennedy et al. [2011c] (Figure 6c). In Hirahara et al. [2013] the changeover starts in the 1940s and is especially rapidly in the early 1960s, being nearly complete by around 1962. The second difference is that the estimated bias during the Second World War is higher in the analysis of Hirahara et al. [2013] than in Kennedy et al. [2011c]. Further work is needed to understand these differences and more complete, more reliable metadata would help reduce uncertainty in SST records.
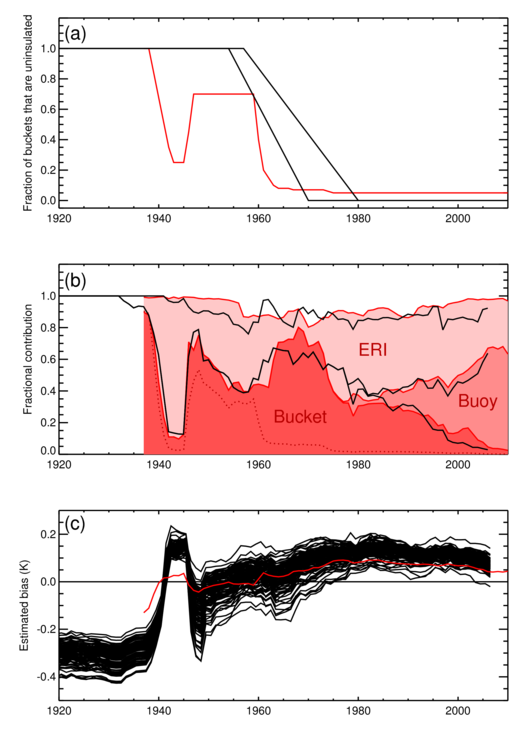
Figure 6: Comparison between COBE-2 (red) and HadSST3 (black) metadata and bias estimates for the period 1920 to 2010. (a) Fraction of buckets assessed as being uninsulated. The two red lines indicate the earliest and latest switchover dates allowed in the generation of the HadSST3 ensemble. (b) Fractional contribution to the global average from buckets, buoys and engine room measurements. The total is less than unity; the remainder are either unknown (in the HadSST3 analysis) or uncategorized (COBE-2). (c) Estimated bias. There are 100 versions of HadSST3 and a single estimate from COBE-2.
Huang et al. [2015] and Huang et al. [2017] did not explicitly consider measurement method when applying their bias adjustment method to measurement made by ships. Their estimates for global average SST in the period 1945-1970 are consistently lower than for Hirahara et al. [2013] and Kennedy et al. [2011c]. This implies a rapid transition to insulated buckets, a larger fraction of ERI measurements or a larger overall bias in ERI measurements during this period. Alternatively, the MAT dataset used for the adjustments might be too cold in this period. The differences betwen Huang et al. [2015] and Kennedy et al. [2011c] are larger than the combined uncertainty estimates would suggest (Kent et al. 2017).
In the post-1941 period, Smith and Reynolds [2003] and Smith and Reynolds [2005] estimated the uncertainty due to pervasive systematic errors by considering the difference in estimated bias between measurements made in the engine rooms of the ships and measurements from all ships between 1994 and 1997. They estimated a minimum 1-sigma standard error in the global average of around 0.015 K. The range is similar to, albeit slightly narrower than, that estimated by Kennedy et al. [2011c]. The difficulty with the approach taken by Smith and Reynolds [2003], Smith and Reynolds [2005] and Smith et al. [2008] is that the quoted uncertainty range is considered to be symmetric whereas Kennedy et al. [2011c] and Hirahara et al. [2013] suggest that the true global mean is consistently higher than Smith et al. [2008] in the period 1945-1960 (Figure 9). It also suggests that the estimate of Smith et al. [2008] in the post World War 2 period (1945-1950s) was slightly too conservative because it compared ERI measurements with a mixture of ERI and insulated bucket measurements, whereas large numbers of observations were made using buckets [Kennedy et al., 2011c; Hirahara et al., 2013].
Previous - 3.3.2 Bias Adjustments 1941 to Present Index Next - 3.3.4 Refinements to Estimates of Pervasive Systematic Errors