Previous - 3.2.1 Uncorrelated Measurement Errors Index Next - 3.2.3 Summary of Individual Observational Errors
3.2.2 Uncorrelated and Systematic Measurement Errors
Kent and Berry [2008] and Kennedy et al. [2011a, 2011b] decomposed the observational errors into uncorrelated and systematic components. Brasnett [2008] and Xu and Ignatov [2010] implicitly used the same error model their analyses output the same statistics produced by Kent and Berry [2008] and the results are indeed very similar (Figure 3). Estimates are summarized in Table 4. The possibility of correlated measurement errors is also implicitly allowed for by Ishii et al. [2003] and Hirahara et al. [2013] who merge observations from a single ship into a super observation before calculating uncertainties. Adding the uncertainties in quadrature gives a combined observational uncertainty of between 1 and 1.5 K, consistent with earlier estimates (Table 1) that did not differentiate between the two.
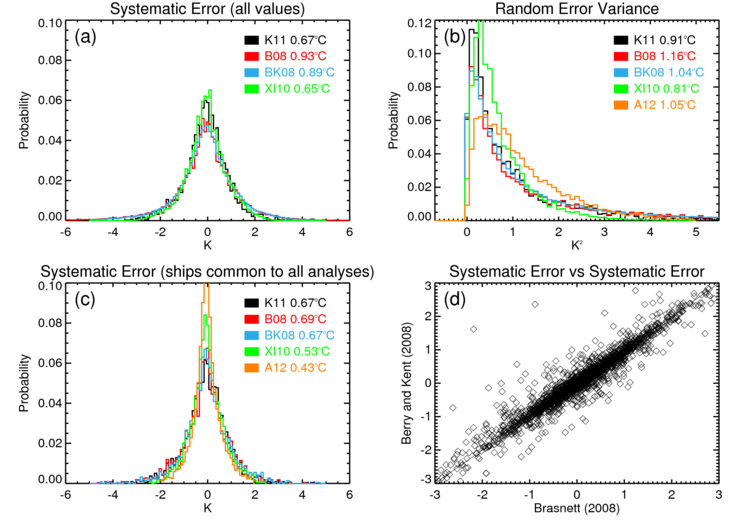
Figure 3: Distributions of estimated measurement errors and uncertainties from ships. (a) distributions of systematic measurement errors for all entries (2003-2007) in Kennedy et al. [2011a], Brasnett [2008], Berry and Kent [2008] and Xu and Ignatov [2010]. (b) distributions of uncorrelated measurement error uncertainties (expressed as variances) from the same analyses as in the top left panel and Atkinson et al. [2013]. (c) as for top left except each ship now has only a single entry so the analyses are directly comparable. (d) scatter plot showing systematic measurement errors estimated by Brasnett [2008] and Berry and Kent [2008] showing the good correlation between the estimates.
In most of the studies listed in Table 4, the systematic component of the error was assumed to be different for each ship, but this does not on its own capture the effects of pervasive systematic errors. Chan and Huybers [2019] showed that there are systematic errors at the level of nations and decks in ICOADS. They argue for the inclusion of a systematic component that operates at this level. The data from Kent and Berry [2008], Brasnett [2008] and Xu and Ignatov [2010] also show that the systematic observational error component for some ships varies from month to month suggesting that the partitioning of systematic and uncorrelated effects is also a function of the time period considered.
| Reference | Platform type | Uncorrelated | Systematic | Notes |
|---|---|---|---|---|
| Chan and Huybers [2019] Table 3 | Ship | 0.55±0.15K2 | 0.78±0.12K2 | After accounting for national level effects |
| Chan and Huybers [2019] Table 3 | Ship | 0.42±0.15K2 | 0.80±0.12K2 | After accounting for deck level effects |
| Kent and Berry [2008] pg 11 Table 5a | Ship | 0.7 K | 0.8 K | From comparison with Numerical Weather Prediction fields provided with VOSClim data |
| Pg 12 Table 5c | Drifter | 0.6 K | 0.3 K | |
| Pg 11 Table 5b | Mooring | 0.3 K | 0.2 K | |
| Kennedy et al. [2011a, 2011b] pg 86 | Ship | 0.74 K | 0.71 K | From comparison with Along Track Scanning Radiometer SST retrievals |
| Pg 86 | Drifter | 0.26 K | 0.29 K | |
| Brasnett [2008] values estimated for present study by author | Ship | 1.16 K | 0.69 K | From comparison with interpolated fields |
| Xu and Ignatov [2010] values estimated for present study by author | Ship | 0.81 K | 0.53 K | From comparison with multisensor satellite SST fields |
| Kennedy et al. [2011a, 2011b] method using Atkinson et al. [2013] whitelist | Ship | 0.56 K | 0.37 K | From comparison with multisensor satellite SST fields |
| Gilhousen [1987] Table 6 pg 104 | Mooring | 0.22 K | 0.13 K | Comparison of moored buoys |
Table 4: List of estimates of measurement error uncertainties for all platforms for studies where the measurement error uncertainty is decomposed into uncorrelated and systematic components.
The addition of a systematic component has a pronounced effect on the uncertainty of large-scale averages comprising many observations. Kennedy et al. [2011b] estimated that the effect of the correlations between errors in individual ship measurements was to increase the uncertainty of the global annual average SST anomaly due to measurement error from 0.01 K (uncorrelated case) to more than 0.05 K in the 19th Century and to more than 0.01 K even in the well-observed modern period when millions of observations contribute to the annual global average (see Figure 8). The Deck-level and nation-level systematic errors identified by Chan and Huybers [2019] would likely lead to an increase in the uncertainty of large scale averages in unadjusted data. However, it is not clear to what extent existing bias adjustment methods deal with the global and regional biases arising from systematic errors at this level.
Berry and Kent [2017] used an error model that combined both uncorrelated and systematic effects to assess the adequacy of the marine observing network. They found that metrics which rely solely on counts of observations in a grid cell or similar area (Zhang et al. 2006, Zhang et al. 2009) typically can misestimate the adequacy of the network because they do not take into account the effect of systematic biases. They found that simply increasing observation counts for SST was not the best way of reducing uncertainty and that increasing the number of ships or buoys was better.
Systematic errors could also have a pronounced effect on reconstructions when they project onto large-scale modes of variability, or on the estimation of EOFs. However, because of the assumed independence of the errors between ships, the correlated component of the uncertainty remains relatively unimportant for the analysis of long-term trends of large-scale averages. Pervasive systematic errors, which are correlated across a large proportion of the global fleet, (section 3.2) are far more important from that point of view. Systematic errors at deck-level or nation-level (Chan and Huybers, 2019) could also affect regional and global trends as these are likely to have large scale effects over multiple years.
One of the difficulties with estimating the uncertainties associated with systematic errors from individual ships is that not all observations in ICOADS can be associated with an individual ship. Some of the reports have no more information than a location, time and SST measurement. Kennedy et al. [2011b] had to make estimates of how the uncertainty arising from systematic errors behaved as the number of observations increased by considering the behavior at times when the majority of reports contained a ship name or call-sign. They assumed that observations without call signs behaved in the same way. Kent and Berry [2008] suggested that only ship reports with extant metadata be used in climate analyses of the modern period to minimize such ambiguities. For earlier periods, the gains in improved quantification of uncertainty would need to be balanced against the increased uncertainty arising from reduced coverage.
Carella et al. [2017] developed an algorithm to assemble ship tracks from marine reports that have missing, non-unique, incorrect or otherwise confusing ID information in ICOADS. They found that they could significantly increase the fraction of observations assigned to coherent tracks for much of the record. They note that the new track assignments could be used to improve estimates of measurement error uncertainty, help with bias adjustment, quality control and data assimilation.
Many gridded SST data sets and analyses, as well as the studies that depend on them, assume that the observational errors are normally distributed, but this is not necessarily the case for individual observations. Kennedy et al. [2011a] investigated the properties of observations that had been quality controlled using the procedures described in Rayner et al. [2006]. They found that in comparisons with satellite observations the distributions of errors were 'fat-tailed' with the distribution of errors having a positive kurtosis. Chan and Huybers [2019] note that the kurtosis is reduced when spatial heterogeneity of matched observations is taken into account.
In the creation of gridded data sets from SST observations, the effects of outliers can be minimized somewhat by the use of resistant or robust statistics such as Winsorised, or trimmed means (see e.g., Rayner et al. [2006]). The effect of outliers is further reduced in large scale averages and the distribution of errors in large scale averages tends towards a normal distribution as the number of observations increases [Kennedy et al., 2011a].
Previous - 3.2.1 Uncorrelated Measurement Errors Index Next - 3.2.3 Summary of Individual Observational Errors