Previous - The Current State of Uncertainty in in situ SST Analyses Index Next - Individual Observational Errors
3.1 Defining sea-surface temperature
Traditionally, in situ SST analyses have been considered representative of the upper ten or so meters of the ocean. However, the near-surface temperature structure of the ocean can be rather complex. Under conditions of low wind speed and high insolation, a stable stratified layer of warm water can form near the surface. For a recent review see Kawai and Wada [2007]. The diurnal temperature range of the sea-surface can, under certain conditions, exceed 5 K and, somewhat attenuated, penetrate to many tens of meters [Prytherch et al., 2013]. This can lead to strong temperature gradients in the upper few meters of the ocean and consequently measurements made at the same time and location but at different depths can record quite different temperatures. Temperatures measured at the same depth but at different times of day can also differ markedly.
Donlon et al. [2007] proposed that the depth of the measurement be recorded along with the temperature as a first step to reconciling measurements made at different depths and different times of day. Donlon et al. [2007] also introduced the concept of an SST foundation (SSTfnd) temperature. The current definition of "SSTfnd, is the temperature free of diurnal temperature variability, i.e., SSTfnd is defined as the temperature at the first time of the day when the heat gain from the solar radiation absorption exceeds the heat loss at the sea surface." It is generally assumed that the upper few meters of the ocean are of approximately constant temperature at this point. Hosoda and Sakaida [2016] point out that the definition given above is actually two definitions. The difference arising from these they assessed and found to be relatively unimportant. SSTfnd has proved a practical reference point for comparing and combining satellite observations [Roberts-Jones et al., 2012] and was intended to provide "a more precise, well-defined quantity than the previous loosely-defined bulk SST" Donlon et al. [2007].
Unfortunately, such niceties of definition are not readily applicable to historical SST measurements and the effect of the interaction between measurement depth and water temperature on SST measurements in in situ archives is not clear. For many ships that measure the temperature of water drawn in below the surface, the depth of the measurements is not known and is likely to have changed depending on how heavily the ship was loaded. Nor is it clear to what extent any warm surface layer is mixed with cooler subsurface water by the passage of the ship or by the interaction of wind, water, Sun and hull [Amot, 1954; Stevenson, 1964]. Similar interactions have been noted closer to the surface with moored buoys [Kawai and Kawamura, 2000]. James and Fox [1972] found that ERI measurements from ships became progressively warmer relative to simultaneous bucket observations as the depth of the ERI measurement increased, a similar pattern to that seen by Kent et al. [1993]. Reynolds et al. [2010] found that measurements made by ships, which were largely ERI measurements in their study period, were on average warmer than nearby drifting buoy observations made nearer to the surface.
A practical solution is to use drifting buoys measurements to define a benchmark, which implies a nominal measurement depth of around 20cm. Drifting buoys are a good benchmark because they are nowadays widely distributed, reasonably accurate and of standardised designs. They are widely used to define "ground truth" for satellite studies either for calibration or validation. Morak-Bozzo et al. [2016] have developed a climatology of SST at the depth of drifting-buoy measurements which, as well as being greographically and seasonally varying, also varies depending on the time of day, wind-speed and cloud cover. Huang et al. [2017] used drifting buoys as a baseline for their ERSSTv5 data set as did Kennedy et al. [2019] in HadSST.4.0.0.0.
The concept of the foundation SST can be used to get an idea of how changing measurement depth might have affected SST trends in the absence of other considerations. Figure 1 shows an upper estimate of the potential size of the effect of changing measurement depth on global average SST over time (for calculation details see Appendix A). The assumption is that buckets and buoys measure in the upper 30 cm and engine room measurements are measuring SSTfnd. The estimated global average bias (relative to the 1961-1990 average) is less than 0.1 K at all times and from 1945 onwards is less than 0.05 K. The bias is largest in the early record when all measurements were made using buckets which sample in the upper meter of the water column. In the more recent period, the blend of buckets, ERI measurements and buoys leads to a smaller, time-varying bias. Although the size of the effect is modest at a global level, locally the average diurnal warming can exceed 0.5K, which would imply a larger effect.
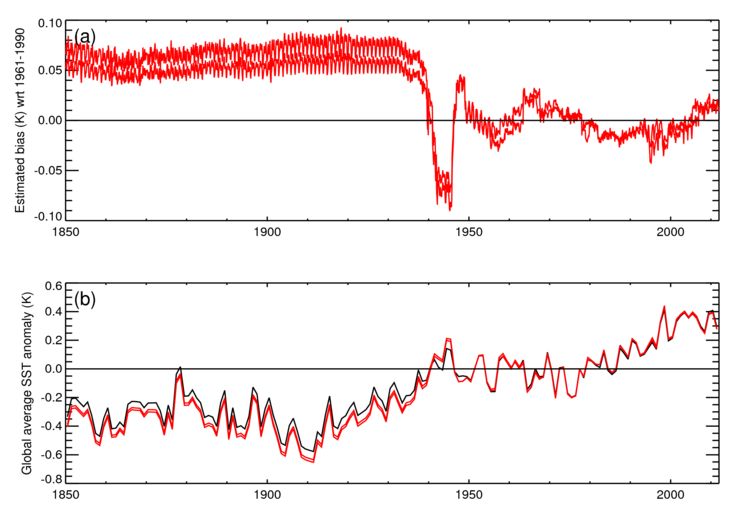
Figure 1: (a) Estimated bias (with respect to the 1961-1990 average) on global average SST anomalies associated with measurement depth as a function of time (upper panel). (b) Global average SST anomaly from the HadSST3 [Kennedy et al. 2011b, 2011c] median before (black) and after (red) the measurement-depth bias has been subtracted. The two red lines reflect different assumptions concerning data that could not be definitively assigned to any particular measurement type. The large dip during World War 2 arises because the majority of observations were ERI measurements.
A related problem is that changing times of observation could potentially interact with the diurnal cycle of temperature leading to spurious trends in the data. Kent et al. [2010] note "The implicit assumption is that the sampling of conditions is regular enough that no regional or time-varying bias is introduced into the datasets by neglecting such effects." Ships currently make SST observations at regular intervals throughout the day, typically every four or six hours, which is sufficient to reduce the aliasing of diurnal cycles, particularly if the measurements are made at depth. During earlier periods when buckets were widely used, there were systematic changes in the time of observation that might have a more pronounced effect on average SSTs but this has not been quantified. Diurnal variations in pervasive systematic errors have also been identified (Carella et al. 2018).
Even when the measurement depth is known, there are potential problems. Metadata in WMO Publication 47 show that ships measure water temperatures through a wide range of depths from the near surface down to around 25 m [Kent et al., 2007]. Although the average depth was typically less than 10 m, the deepest measurements could be sampling water that is colder than the SSTfnd. How large this effect might be is not yet well understood.
Chiodi and Harrison [2006] identified large-scale warm surface features using SST retrievals from microwave satellite instruments that persisted for several days. The warm layer was observed at night suggesting that the effect was independent from diurnal warming and they hypothesized that the multi-day warming might have been confined to a relatively shallow layer between 1 and 5 m thick. The implication is that the depth of the SST foundation temperature can vary rapidly and that it can be much shallower than the deepest in situ SST measurements. During a two week cruise, Matthews and Matthews [2013] found persistent temperature difference between the surface and 3 m depth in the tropical Pacific. Similar warm layers can be seen in data from moored buoys. Figure 2 shows time series from several moorings showing multi-day near-surface warm layers that do not penetrate down to 10 m and in some cases do not reach 5 m. Climatologies of mixed layer depth (MLD, see for example de Boyer Montégut [2004]) indicate large areas in regions of upwelling and in the summer hemisphere where the average MLD is shallower than 30 m, implying measurable temperature gradients within the depth range of ship SST measurements. Grodsky et al. [2008] also found differences between SST and temperatures in the mixed layer, which were largest in areas of persistent upwelling most notably the eastern Pacific but they did not consider the possible confounding effects of systematic errors in SST or other measurements.
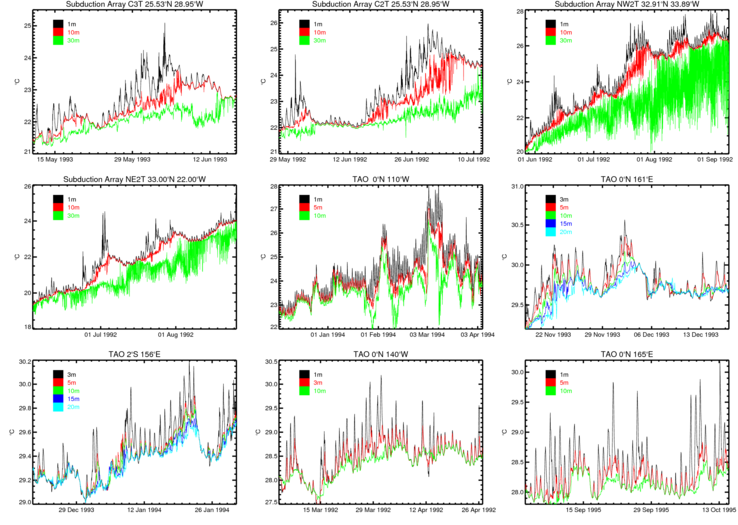
Figure 2: Time series of upper ocean temperatures (0-30 m) from nine moorings in the Tropical Ocean Atmosphere (TAO) array and the Subduction Array. The mooring and its location are given above each plot. The different coloured lines represent different depths and these are indicated by the legends in each panel. The Subduction Array data are described in Moyer and Weller [1997].
To isolate the specific effect of multi-day or persistent temperature stratification of the near-surface waters would require regular measurements of near-surface waters at a range of depths. Such an analysis is now possible thanks to the network of Argo floats [Castro et al., 2013] particularly those with dedicated sensors for making near-surface measurements. In what follows, it should be noted that variations in depth will contribute to the variance of measurements and will therefore be partly, or wholly, counted in estimates of uncorrelated and systematic measurement errors.
Previous - The Current State of Uncertainty in in situ SST Analyses Index Next - Individual Observational Errors